Support organisation - Accessing the metrics dashboard
About the dashboard
The metrics dashboard can be used to view summary information about the NHS Innovation Service, such as the numbers of innovations submitted, as well as measuring performance against KPIs. Only champions at support organisations, the needs assessment team, core management team and communications team have access to the dashboard. To view it, they need:
- An OKTA account (self-registered)
- Correctly configured Tableau permissions (arranged by the service management team)
We need tightly controlled permissions because the dashboard has drill down options which allow users to see individual innovation names. We need to ensure users can only see innovations where the innovator has agreed to share with their organisation. If users do not have permission to view certain tabs, they will appear but will not load any data.
Applying for access
Only senior sponsors and champions at support organisations, the needs assessment team, service management team and communications team can have access to the dashboard.
If you are one of these user types, please email nhsinnovationservice@nhs.net with the subject "Metrics dashboard access" for instructions on how to register.
Using the dashboard
Once you have received the link to the dashboard, you will need to log in to your OKTA account. If you receive an error message at first, try refreshing the page.
You can click through the different tabs at the top of the screen to see views tailored to different stakeholders. Please note, visualisations which you do not have access to will not load. This is so we can comply with innovators' data sharing preferences.
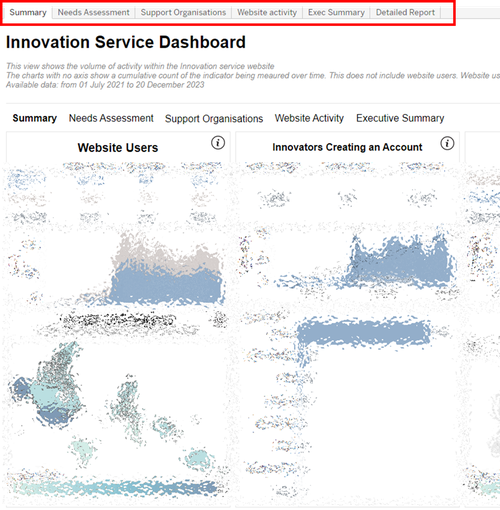
The most useful visualisations for champions will be under the “Support organisations” tab. Here you can view your organisation's KPIs, as well as responses from innovators to the end-of-support survey, the number of support summary templates your organisation has used as an indicator of support or progress, and the number of innovations referred between your organisation and the other support organisations. Try hovering your mouse over the charts to see more information.
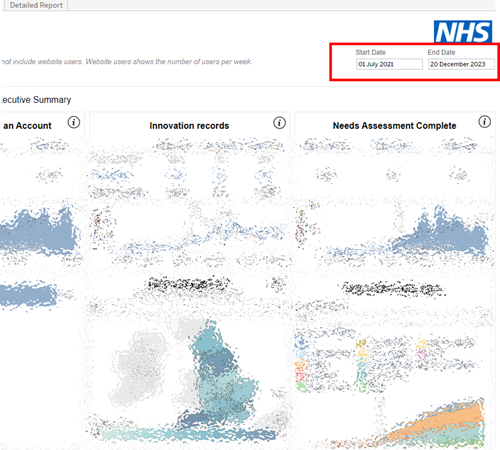
You can restrict the data to certain time periods by adjusting the start and end dates in the top right hand corner of the page or on each chart. Users from support organisations will only be able to see detailed information for their own organisation.
The earliest date available is 1st July 2021, the start of the month the first innovations were submitted during the private beta phase of the service. The service was first made available to the public at the end of July 2022.
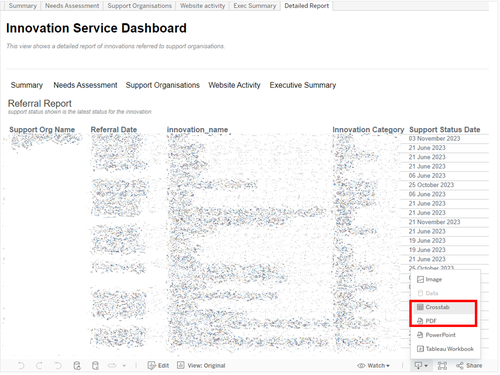
Another useful feature is the ability to export. To export data, click the square icon with the arrow pointing down in the bottom right of the screen. There are several options but the most useful formats tend to be PDF and cross tab (Excel). You need to select the visualisations you want to be included in the export.
If you are a champion, exporting is especially useful on the "Detailed report" tab, which is automatically populated with the innovations which have been suggested to or engaged with by your organisation and the most recent outcomes for each.